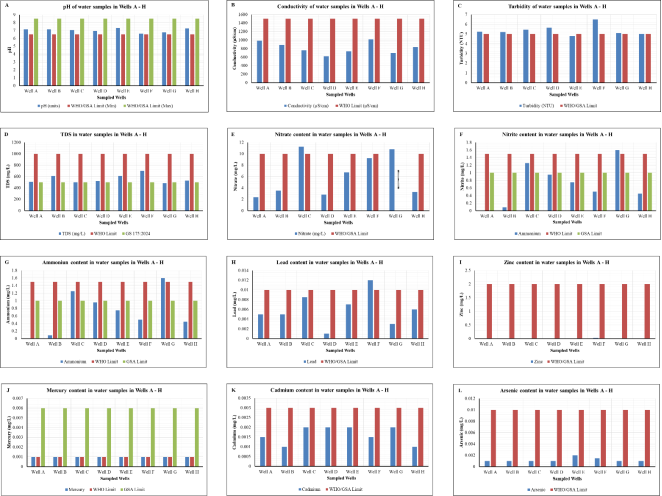
1. Introduction
Water is an essential resource for maintaining human life and playing a key role in agriculture, energy, and economic activities. Additionally, it plays a fundamental role in the functioning of a healthy ecosystem
| [1] | Bessah E., Raji A. O., Taiwo O. J., et al. (2021) Assessment of surface waters and pollution impacts in Southern Ghana. Hydrology Research, 52(6). 1423-1435. https://doi.org/10.2166/nh.2021.051 |
[1]
. Water for domestic use must be clean, safe, affordable, and accessible to every human society to promote healthy living standards and empowerment. Unfortunately, about 2.1 billion people globally still lack access to safe drinking water according to a report by WHO and UNICEF joint monitoring programme for water supply, sanitation and hygiene
| [2] | Progress on household drinking water, sanitation and hygiene 2000–2024: special focus on inequalities. Geneva: World Health Organization (WHO) and the United Nations Children’s Fund (UNICEF), (2025). Licence: CC BY-NC-SA 3.0 IGO. |
[2]
. Ensuring access to clean and safe water requires both global and local efforts. The United Nations recognizes this through its resolution on the human right to safe drinking water and sanitation, which emphasizes that water for drinking and sanitation must be safe, affordable, acceptable, accessible, and available
| [3] | Mohammad, A., Asgedom, A. G., Mokenen, K. N., Tesfay, A. H., Gebretsadik, T. T., Bruggen, V. d. B. (2024) Evaluation of groundwater quality for drinking water using a quality index in Abyi Adi, Tigrai, Northern Ethiopia. Heliyon, 10(16): e36173. https://doi.org/10.1016/j.heliyon.2024.e36173 |
[3]
. The lack of access to safe drinking water and sanitation services has been linked to various forms of diseases, including diarrhea, dengue, cholera, and soil-transmitted helminth disease
| [4] | Dekker D. M., Krumkamp R., Sarpong N., Frickmann H., et al. Drinking water from dug wells in rural Ghana—Salmonella contamination, environmental factors, and genotypes. Int J Environ Res Public Health. 2015; 12(4): 3535-46.
https://doi.org/10.3390/ijerph120403535 |
[4]
.
Surface water bodies are natural freshwater sources that supply water for domestic, agricultural and industrial uses
| [5] | Abanyie S. K., Ampadu B., Frimpong N. A., Amuah E. E. Y. (2023) Impact of improved water supply on livelihood and health: Emphasis on Doba and Nayagnia, Ghana. Innov Green Dev. 2: 100033. https://doi.org/10.1016/j.igd.2023.100033 |
[5]
. Groundwater usually drawn up from boreholes and wells is also an important source of water serving many rural and peri-urban communities in developing countries
| [6] | World Health Organization. Guidelines for drinking-water quality [electronic resource] : incorporating 1st and 2nd addenda, vol. 1, Recommendations. 3rd ed. Geneva: World Health Organization, (2008). |
[6]
. However, the water quality and safety of these sources are continually being threatened and compromised by population growth, urbanization, industrialization, poor sanitation infrastructure and practices, agricultural activities, climate change, natural and other human activities that lead to contamination and pollution of the water ecosystems
| [7] | Fayomi G. U., Onyari E. K., Jaiyeola A. T., Ode G. O. (2024) Unveiling the outcome of multispectral indices in evaluating total suspended solid of water quality. Remote Sensing Applications: Society and Environment. 36: 101381.
https://doi.org/10.1016/j.rsase.2024.101381 |
| [8] | Rajeswari C. V., Saraswathi B. (2009) Assessment of water quality of rivers Tungabhadra and Hundri, India. Nature Environment and Pollution Technology. 28: 499–505. |
[7, 8]
. Physicochemical contaminants such as trace metals (e.g. Cd, Hg, Pb, etc.) and biological pollutants (e.g. bacteria, protozoa, etc.) can pose significant health risks, including infections, typhoid, gastrointestinal conditions, cancer, kidney disease, liver damage, and neurological disorders. Evaluating heavy metals in drinking water is crucial because it provides insights into the health risk associated with harmful contaminants such as lead, arsenic, mercury, and cadmium
| [9] | Jomova, K., Alomar, S. Y., Nepovimova, E., Kuca, K., & Valko, M. (2025). Heavy metals: Toxicity and human health effects. Archives of Toxicology. Springer Nature.
https://doi.org/10.1007/s00204-025-03746-7 |
| [10] | Sell, I., & Kask, I. (2021). An overview of the biological impacts of heavy metals. International Journal of Molecular Biology and Biochemistry, 3(2), 01–05.
https://doi.org/10.33545/26646501.2021.v3.i2a.56 |
| [11] | S. Arora, P. Saha, A. D. Shende. (2025). Assessment of heavy metal pollution of surface water through multivariate analysis, HPI and GIS techniques. Water Practice & Technology, 20(1), 148. https://doi.org/10.2166/wpt.2025.010 |
| [12] | M. Latif, I. Nasim, M. Ahmad, R. Nawaz, et al. (2025) Human health risk assessment of drinking water using heavy metal pollution index: a GIS‑based investigation in mega city. Applied Water Science 15: 12.
https://doi.org/10.1007/s13201-024-02341-w |
[9-12]
. The degrading water quality and safety is a serious concern and has become a global challenge that requires urgent interventions
| [13] | Kumar D., Kumar R., Sharma M., Awasthi A., Kumar M. (2024) Global water quality indices: Development, implications, and limitations. Total Environment Advances. 9: 200095. https://doi.org/10.1016/j.teadva.2023.200095 |
[13]
.
Groundwater drawn up from open wells serves as a major source of water for many residents in Ghana and in particular, the Sagnarigu Municipality in the Northern Region. However, these open wells remain largely unregulated and unprotected with significant risk of contamination from surface runoffs, poor sanitary environments and human activities
. Abdul S. et al. (2025) conducted a case study risk assessment of hand-dug well water in Aflao in Ghana by analyzing heavy metal and microbial contamination. The findings revealed that the heavy metal contents were below detection limits with the microbial loads exceeding the WHO guidelines
. Iddrisu et al. (2024) in a recent study conducted in the Nanton District, Northern Ghana, reported that approximately 83.3% of 30 groundwater samples analyzed had their physicochemical parameters falling within WHO guidelines but with a widespread microbial contamination in all the samples. Parameters such as iron, manganese, color, turbidity, nitrates, sulfate, and pH were identified as potential influencers of microbial survival in the groundwater
| [15] | U. F. Iddrisu, E. K. Tetteh, B. S. Amedorme, V. C. Mbatchou. (2024) Assessing the groundwater quality in Ghana’s Nanton District: comprehensive evaluation and implications for sustainable management. AQUA-Water Infrastructure, Ecosystems and Society 73(1), 34.
https://doi.org/10.2166/aqua.2024.196 |
[15]
. In a similar study, Iddrisu et al. (2023) assessed groundwater in Talensi District in the Upper East Region, Ghana. The results of the study revealed that the physicochemical parameters were within WHO guidelines but identified coliform bacteria in several boreholes and wells
| [16] | U. F. Iddrisu, E. K. Armah, E. K. Tetteh, B. S. Amedorme. (2023). Assessing groundwater quality: a case study in Ghana Talensi district. Water Practice & Technology 18(9), 2096
https://doi.org/10.2166/wpt.2023.135 |
[16]
.
There is limited research that has assessed the water quality and safety from open wells in the Sagnarigu Municipality. This gap in knowledge leaves the residents in the Municipality exposed to potential health crises linked to poor water quality and safety. Water quality is a key indicator of its suitability and safety for human use, and its assessment must involve the determination of the microbial and physicochemical parameters that are markers of water contamination and pollution. A systematic assessment of the microbial and physicochemical water quality parameters is therefore essential to safeguard public health safety and guide future water management policies in the Municipality. The main purpose of the study was to assess the quality and safety of water drawn from open wells in the Municipality by analyzing the microbial and physicochemical parameters using WHO and Ghana Standard Authority (DGS 175: 2021) benchmarks. The present study is the first systematic evaluation of the water quality and safety of open wells in the Sagnarigu Municipality and would provide evidence for urgent public health interventions by local authorities and policy decision-makers.
2. Materials and Methods
2.1. Study Area Description
The study was conducted to evaluate the microbial and physicochemical quality of water drawn from open wells located within the Sagnarigu Municipality in the Northern Region of Ghana. The Sagnarigu Municipality is a peri-urban district which lies between latitudes 9°16’ and 9°34’ North and longitudes 0°36’ and 0°57’ West with its Administrative capital being Sagnerigu. It covers a total land area of 200.4 km
2 with a population size of 341,711 based on the Ghana Population and Housing census 2021. It shares borders with the Tamale Metropolis to the East and South, Tolon District and Kumbungu District to the West and Savelugu Municipality to the North. It has seen rapid urbanization in recent years. The Municipality comprises a blend of residential communities, informal settlements, farmlands, and semi-rural zones, which makes it a critical area for examining water quality challenges in the Municipality
| [17] | Ghana Population and Housing Census, (2021). |
[17]
. Water sources in the Municipality, particularly open wells, remain vital for household use, especially in areas where piped water infrastructure is inadequate or unreliable. The continued reliance on these wells, many of which are unprotected, raises concerns of potential contamination from nearby pit latrines, surface runoff, animal activity, refuse dumps, and other anthropogenic influences
| [18] | Amuah E. E. Y., Amanin-Ennin, P., Antwi, K. (2022) Irrigation water quality in Ghana and associated implications on vegetables and public health. A Systematic Review. Journal of Hydrology, 604, Article 127211.
https://doi.org/10.1016/j.jhydrol.2021.127211 |
[18]
.
2.2. Sampling of Open Wells
The sampling of the open wells was guided by factors such as proximity to human and animal activities, sanitation infrastructure, waste disposal practices, population density, and other observed environmental conditions at the sites. Each location was geotagged and documented with field-style environmental observations to complement laboratory findings on microbial and chemical parameters. This study area, with its unique blend of rapid development, traditional practices, and limited access to safe water infrastructure, offers a representative case for understanding the public health implications of groundwater contamination in northern Ghana. A total of eight (8) open wells were purposively sampled and designated as Well A, B, C, D, E, F, G, and H across different communities within the Municipality.
2.3. Water Sample Collection
The water samples were collected in the morning hours (8: 00 – 10: 00 am GMT) as a single event during the onset of the rainy season in April 2025. Eight water samples were collected from the designated wells (Well A to H) based on the standard protocol outlined in the Standard Methods for the Examination of Water and Wastewater by the American Public Health Association. The water samples were collected in clean, sterile, wide-mouth, nonreactive plastic bottles specifically designed for microbiological use. Each container was fitted with a non-leaking cap and a non-toxic liner capable of withstanding repeated sterilization, thereby ensuring that the integrity of the samples was maintained during transport and storage below 10
oC in ice chest. Before water sample collection, dechlorination was performed to neutralize halogens and prevent microbial activity during transit. This ensured that the microbiological composition of the samples remained unaltered before laboratory analysis
| [19] | Baird, R. B., Eaton, A. D., & Rice, E. W. (Eds.). (2017). Standard methods for the examination of water and wastewater (23rd ed.). Washington, D.C.: American Public Health Association, American Water Works Association, Water Environment Federation. |
[19]
.
2.4. Analysis of Water Quality Parameters
The analyses of the water quality parameters were conducted on each open well water sample within 24 hours after sample collection using calibrated and certified equipment in the Environmental Quality Laboratory of the Council for Scientific and Industrial Research, Water Research Institute, Tamale. Microbiological and physicochemical parameters of the water samples were analyzed to assess the water quality and safety of the open wells in the Sagnarigu Municipality. The analytical results were compared with the standard benchmarks of WHO and Ghana Standard Authority (DGS 175: 2021)
| [20] | World Health Organization. (2022). Guidelines for drinking-water quality: Fourth edition incorporating the first and second addenda. Geneva: World Health Organization. Licence: CC BY-NC-SA 3.0 IGO. |
| [21] | Ghana Standard Authority, DGS 175: 2021 Guidelines. |
[20, 21]
.
2.5. Analysis of Microbial Quality
Microbial quality is a critical parameter of water potability and safety. It is assessed by analyzing the microbial loads of
Escherichia coli and total coliforms as the critical indicators of faecal contamination of water.
E.
coli and total coliforms represent the density of the bacterial population in drinking water and are the most determined indicators to measure pollution level and water quality
| [22] | Adamou H., Ibrahim B., Salack S., Adamou R., Sanfo S., Liersch S. (2020) Drinking water quality in a rural area of Western Niger: a case study of Bonkoukou. Journal of Water and Health, 18(1). 77-90. |
[22]
. The microbial quality of the water samples was assessed within 24 hours of collection by testing
E. coli and total coliforms using standard total coliform fermentation technique and membrane filtration technique respectively
| [19] | Baird, R. B., Eaton, A. D., & Rice, E. W. (Eds.). (2017). Standard methods for the examination of water and wastewater (23rd ed.). Washington, D.C.: American Public Health Association, American Water Works Association, Water Environment Federation. |
| [23] | Addisie M. B. (2022) Evaluating drinking water quality using water quality parameters and esthetic attributes, Air, Soil and Water Research, 15. 1-8. |
[19, 23]
. The resultant colonies per 100 mL of samples were counted using a digital illuminated colony counter to ensure accuracy in the enumeration.
2.6. Analysis of Physicochemical Parameters
The physicochemical parameters of the water samples were analyzed according to the standard methods for the examination of water and wastewater by the American Public Health Association
| [19] | Baird, R. B., Eaton, A. D., & Rice, E. W. (Eds.). (2017). Standard methods for the examination of water and wastewater (23rd ed.). Washington, D.C.: American Public Health Association, American Water Works Association, Water Environment Federation. |
[19]
. The physicochemical parameters analyzed were pH, turbidity, total dissolved solids (TDS), conductivity, nitrate, nitrite, ammonium, and heavy metals (e.g. Pb, Zn, Cd, etc.).
For the analysis of the physical parameters, specific instruments were employed to ensure accuracy and reliability. The measurement of pH was carried out using the Hanna HI98191 pH/ORP/ISE Meter. Turbidity was determined by the Hach 2100Q Portable Turbidimeter. Total dissolved solids (TDS) were measured using the HM Digital COM100 TDS Meter. Electrical conductivity was analyzed using Eutech CON700 Conductivity Meter.
The chemical analysis of inorganic contaminants in the water samples was conducted using rigorously standardized methods to ensure accuracy and reliability of the results. Nitrate concentrations were assessed through UV-visible spectrophotometry, specifically at 220 nm and 275 nm. This procedure followed the standard methods for the examination of water and wastewater (APHA)
| [19] | Baird, R. B., Eaton, A. D., & Rice, E. W. (Eds.). (2017). Standard methods for the examination of water and wastewater (23rd ed.). Washington, D.C.: American Public Health Association, American Water Works Association, Water Environment Federation. |
[19]
. The use of dual wavelengths allowed for the correction of potential interferences, thereby improving precision in nitrate quantification. Nitrite determination was carried out using the colorimetric method at a wavelength of 543 nm. This approach relies on the formation of a colored azo dye complex, the intensity of which correlates directly with nitrite concentration, providing a sensitive and specific means of detection. Ammonium levels were quantified using Nessler’s reagent method, in which ammonium ions react with Nessler’s reagent to form a yellow-brown complex. The reagents used were of analytical grade, procured from Sigma Aldrich, ensuring that the sensitivity and accuracy of the method were maintained in line with laboratory best practices.
Heavy metals, including lead (Pb), zinc (Zn), cadmium (Cd), arsenic (As), and mercury (Hg), were analyzed using atomic absorption spectrophotometry (AAS). The measurements were conducted on a PerkinElmer AAnalyst 400 Atomic Absorption Spectrometer (USA). This instrument, equipped with a flame atomization system, allowed for the precise detection of trace metal concentrations. The analysis adhered to APHA Method 3111 B (Flame AAS), which is a globally recognized standard for heavy metal analysis in environmental samples. Before the heavy metal analysis, the samples were filtered with Whatman 0.45 μm paper and reacted with 10% HNO
3 to deactivate the activities of microbes and preserve the ions in solution
| [24] | Anang E., Tei M., Antwi A. B., Aduboffour V. K., Anang B. (2023) Assessment of groundwater and surface water quality in a typical mining community: application of water quality indices and hierarchical cluster analyses. Journal of Water and Health. 21(7). 925-938.
https://doi.org/10.2166/wh.2023.063 |
[24]
.
3. Results and Discussion
The results of microbial and physicochemical parameters of the eight (8) sampled wells in the Sagnarigu Municipality are presented and discussed. The microbial loads of total coliform and
E.
coli in the sampled wells reveals faecal contamination and highlight the potential health risks associated with the waterborne diseases. The physicochemical parameters are essential for assessing not only the overall safety of drinking water but also its aesthetic quality. The results of the present study is consistent with the findings reported by Iddrisu et al. (2024) and Abdul S. (2025) which both reported widespread microbial contamination with microbial loads exceeding WHO guidelines and physicochemical parameters being within the guidelines
| [14] | Abdul S., Dwumfour-Asare B., Mensah G. T., Owusu-Mensah I. (2025) Journal of Water, Sanitation and Hygiene for Development 15(6), 507. https://doi.org/10.2166/washdev.2025.333 |
| [15] | U. F. Iddrisu, E. K. Tetteh, B. S. Amedorme, V. C. Mbatchou. (2024) Assessing the groundwater quality in Ghana’s Nanton District: comprehensive evaluation and implications for sustainable management. AQUA-Water Infrastructure, Ecosystems and Society 73(1), 34.
https://doi.org/10.2166/aqua.2024.196 |
[14, 15]
.
3.1. Microbial Water Quality
Table 1 and
Figure 1 display the total coliform and
Escherichia coli counts across all eight wells, assessed using APHA Standard Methods 9222A and 9260F, respectively
| [25] | U.S. Environmental Protection Agency, Technical Support Center. (2017). Analytical methods approved for drinking water compliance monitoring under the revised total coliform rule. Washington, DC: U.S. Environmental Protection Agency. |
[25]
. The results of the microbial analysis of the water samples revealed widespread contamination across all the sampled wells. The microbial loads far exceeded the WHO and GS acceptable limit of less than 1 cfu/100 mL for both
E. coli and total coliforms, with values ranging from 2-60 cfu/100 mL for total coliforms and 5-80 cfu/100 mL for
E. coli. These figures are alarmingly high, considering the maximum allowable limits set by both WHO and GSA. This clearly indicates severe faecal contamination, likely due to poor sanitation infrastructure, proximity of the wells to pit latrines, or surface water runoff during rains and highlights a significant public health concern. Among the wells, Wells F and D presented the highest risk, recording the most alarming microbial loads. Such elevated levels strongly suggest the influence of nearby contamination sources, including latrines, surface runoff, or animal waste. In contrast, Wells G and H had relatively lower microbial loads compared to the others. However, their values still exceeded the permissible limits and remained microbiologically unsafe with potential health risks. With these high levels of microbial loads of total coliform and
E.
coli, the residents in the Municipality are exposed to potential health crises and are likely to be infected with waterborne diseases such as typhoid, cholera, diarrheal diseases and among others
| [26] | Yeboah S. I. I. K., Antwi-Agyei P., Domfeh M. K. (2022) Drinking water quality and health risk assessment of intake and point-of-use water sources in Tano North Municipality, Ghana. Journal of Water, Sanitation and Hygiene for Development, 12(2). 157. https://doi.org/10.2166/washdev.2022.152 |
[26]
.
Figure 1. Microbial load of total coliform and E. coli in the water samples from Wells A-H compared with WHO and GSA standards.
Table 1. Microbial Quality of Water Samples from Wells A–H compared with WHO and GSA standards.
Sampled Wells | E. coli (cfu/100 mL) | Total Coliform (cfu /100 mL) | GSA (DGS 175: 2021) cfu/100 mL | WHO Guideline cfu/100 mL |
Well A | 20 | 54 | <1 | <1 |
Well B | 5 | 34 | <1 | <1 |
Well C | 12 | 18 | <1 | <1 |
Well D | 48 | 71 | <1 | <1 |
Well E | 28 | 36 | <1 | <1 |
Well F | 60 | 80 | <1 | <1 |
Well G | 2 | 5 | <1 | <1 |
Well H | 9 | 10 | <1 | <1 |
3.2. Physicochemical Water Quality
The physicochemical quality parameters analyzed for the water samples were compared with the WHO and GS standard benchmarks and the results are presented in
Table 2 with the summary descriptive statistics presented in
Table 3. The analysis of the physicochemical quality of the sampled wells revealed several notable patterns.
3.3. pH of Water Samples
pH is an essential parameter in water quality assessment. pH of water determines the solubility of chemical constituents such as nutrients and heavy metals and biological availability
| [26] | Yeboah S. I. I. K., Antwi-Agyei P., Domfeh M. K. (2022) Drinking water quality and health risk assessment of intake and point-of-use water sources in Tano North Municipality, Ghana. Journal of Water, Sanitation and Hygiene for Development, 12(2). 157. https://doi.org/10.2166/washdev.2022.152 |
[26]
. As seen in
Table 2 and
Figure 2A, the pH values of the Wells ranged between 6.60–7.30 and were all found to be within the WHO and GS acceptable range of 6.5–8.5, indicating neutral water quality. While pH is not a direct toxicological parameter, it is an operational lever in that water with less than pH 6.5 is more corrosive, which can enhance the leaching of toxic metals such as lead, cadmium or copper from plumbings and mineral rocks into the water. Water with pH higher than 8.0 can drive scaling and affect disinfectant performance
| [27] | Aryal J., Gautam B., Sapkota N. (2012) Drinking water quality assessment. J Nepal Health Res Counc. 10(3). 192-6. |
[27]
.
3.4. Conductivity Measurement
The conductivity value is an index that represents the concentration of soluble salts that affect the taste of drinking water source
| [23] | Addisie M. B. (2022) Evaluating drinking water quality using water quality parameters and esthetic attributes, Air, Soil and Water Research, 15. 1-8. |
[23]
. From
Table 2 and
Figure 2B, Well F had the highest electrical conductivity and Well D recorded the least conductivity compared to the other wells. However, the electrical conductivity levels recorded were below the 1,500 μS/cm limit outlined by the WHO and GSA guidelines, thus showing that the electrolytes in the water samples were relatively low
| [24] | Anang E., Tei M., Antwi A. B., Aduboffour V. K., Anang B. (2023) Assessment of groundwater and surface water quality in a typical mining community: application of water quality indices and hierarchical cluster analyses. Journal of Water and Health. 21(7). 925-938.
https://doi.org/10.2166/wh.2023.063 |
[24]
.
The conductivity of water has no direct health risk, but high conductivity indicates the addition of some pollutants to it
| [27] | Aryal J., Gautam B., Sapkota N. (2012) Drinking water quality assessment. J Nepal Health Res Counc. 10(3). 192-6. |
[27]
.
3.5. Turbidity Measurement
Turbidity is a critical parameter as it can interfere with disinfection processes and provide a medium for microbial growth
| [28] | Omar A. I., Mohamed M. A., Jalei A. A., et al. (2025) Assessing drinking water quality in compliance with WHO standards: Analysis of physicochemical and bacteriological parameters in Mogadishu, Somalia. Sustainable Environment, 11(1). 1-11. https://doi.org/10.1080/27658511.2025.2479890 |
[28]
. From
Table 2 and
Figure 2C, the turbidity levels in Wells A, B, C, D, and F exceeded the WHO and GSA guideline values of 5 NTU with Well G barely exceeding the limit
| [21] | Ghana Standard Authority, DGS 175: 2021 Guidelines. |
| [29] | World Health Organization. (2003). Total dissolved solids in drinking-water: Background document for development of WHO guidelines for drinking-water quality (WHO/SDE/WSH/03.04/16). Geneva: World Health Organization. |
[21, 29]
. Wells E and H were within the acceptable measure of water quality. The exceedances observed across multiple wells suggest widespread contamination, possibly due to poor well protection, proximity to latrines, surface runoff intrusion, agricultural runoff, water drawing containers, or unlined well walls that allow surface water intrusion. Turbidity not only reduces aesthetic acceptability making water appear cloudy or unclean but also indicates that the microbial risk is likely underestimated, since particulate matter can harbor bacteria and viruses
| [29] | World Health Organization. (2003). Total dissolved solids in drinking-water: Background document for development of WHO guidelines for drinking-water quality (WHO/SDE/WSH/03.04/16). Geneva: World Health Organization. |
[29]
.
Elevated turbidity indicates the presence of suspended particles such as clay, silt, organic matter, and microorganisms that impair water clarity. From a public health standpoint, this is of great concern because high turbidity can shield pathogenic organisms like
E. coli and other enteric pathogens from disinfection, thereby increasing the risk of waterborne disease transmission
| [30] | LeChevallier, M. W., Evans, T. M., Seidler, R. J. (1981) Effect of turbidity on chlorination efficiency and bacterial persistence in drinking water. Applied and Environmental Microbiology, 42(1). 159–167.
https://doi.org/10.1128/aem.42.1.159-167.1981 |
[30]
. Given that clear water is critical for both acceptability and safety, the observed turbidity levels highlight the urgent need for improved construction, regular cleaning, and community-level interventions such as fencing of wells, proper drainage, and covering of openings. In addition, treatment methods like sedimentation, filtration, or boiling may be required at the household level to mitigate health risks.
3.6. Total Dissolved Solids in Water Samples
TDS is a measure of the total dissolved solids in water that comprises inorganic salts, principally calcium, magnesium, potassium, sodium, bicarbonates, chlorides and sulfates, and small amounts of organic matter that are dissolved in water. TDS in drinking-water originates from natural sources, sewage, urban runoff, and industrial wastewater. Concentrations of TDS in water vary considerably in different geological regions owing to differences in the solubility of minerals
| [29] | World Health Organization. (2003). Total dissolved solids in drinking-water: Background document for development of WHO guidelines for drinking-water quality (WHO/SDE/WSH/03.04/16). Geneva: World Health Organization. |
[29]
. As can be referenced from
Table 2 and
Figure 2D, the levels of TDS in Wells B, D, E, F, and H) were above the GSA limit of 500 mg/L. The TDS in Wells C and G were within the GSA limit with Well A barely exceeding the limit. While this is of concern from a national standards perspective, it is important to note that all the recorded TDS values were still below the WHO threshold of 1000 mg/L and may not pose an immediate health risk. This indicates that although the water may not fully comply with local standards, it remains within the broader international guideline and may not pose an immediate health risk. The exceedance of DGS 175: 2021 suggests that local geological formations or anthropogenic activities (e.g., agricultural runoff, waste leaching) are contributing to mineral loading in Wells B, D, E, F, and H. The fact that all wells remain within WHO limits suggests that the water may still be consumable but requires monitoring and possible treatment (e.g., reverse osmosis or activated carbon filtration) to improve acceptability and compliance with national standards
. From a public health perspective, no health-based guideline values have been proposed for TDS by the WHO. Water with a TDS content of less than about 600.00 mg/L is generally considered as good. However, high TDS content can significantly cause undesirable taste, hardness, and scaling properties to water, making it less acceptable for domestic use
| [22] | Adamou H., Ibrahim B., Salack S., Adamou R., Sanfo S., Liersch S. (2020) Drinking water quality in a rural area of Western Niger: a case study of Bonkoukou. Journal of Water and Health, 18(1). 77-90. |
| [24] | Anang E., Tei M., Antwi A. B., Aduboffour V. K., Anang B. (2023) Assessment of groundwater and surface water quality in a typical mining community: application of water quality indices and hierarchical cluster analyses. Journal of Water and Health. 21(7). 925-938.
https://doi.org/10.2166/wh.2023.063 |
[22, 24]
.
3.7. Nitrate and Nitrite Content in Water Samples
Nitrate and nitrite concentrations were another area of concern, Nitrate and nitrite contaminations are often associated with agricultural runoff, particularly from fertilizer use or leachate from poorly managed sanitation systems. The level of nitrate and nitrite in drinking water causes diseases such as blue baby syndrome, cancer and bleeding of spleen
| [5] | Abanyie S. K., Ampadu B., Frimpong N. A., Amuah E. E. Y. (2023) Impact of improved water supply on livelihood and health: Emphasis on Doba and Nayagnia, Ghana. Innov Green Dev. 2: 100033. https://doi.org/10.1016/j.igd.2023.100033 |
| [23] | Addisie M. B. (2022) Evaluating drinking water quality using water quality parameters and esthetic attributes, Air, Soil and Water Research, 15. 1-8. |
[5, 23]
.
From
Table 2 and
Figure 2E, the results show that nitrate concentrations in the wells ranged from 2.35 mg/L to 11.25 mg/L. According to both the WHO and GSA, the permissible limit for nitrate in drinking water is 50 mg/L. All the wells had nitrate content below the permissible limits. Elevated nitrate levels in groundwater are often associated with agricultural runoff, improper waste disposal, and leaching from latrines or septic systems. Chronic exposure to high nitrate concentrations is linked to methemoglobinemia or “blue baby syndrome” in infants, as well as possible long-term risks of certain cancers due to endogenous formation of N-nitroso compounds. The detection of elevated levels in some wells highlights the vulnerability of shallow groundwater sources in peri-urban and rural areas where agriculture and poor sanitation are common
| [32] | Knobeloch, L., Salna, B., Hogan, A., Postle, J., Anderson, H. A. (2000) Blue babies and nitrate-contaminated well water. Environmental Health Perspectives, 108(7). 675–678.
https://doi.org/10.1289/ehp.00108675 |
| [33] | Ward, M. H., Jones, R. R., Brender, J. D., de Kok, T. M., Weyer, P. J., Nolan, B. T., Villanueva, C. M., van Breda, S. G. (2018) Drinking water nitrate and human health: An updated review. International Journal of Environmental Research and Public Health, 15(7). 1557. https://doi.org/10.3390/ijerph15071557 |
[32, 33]
.
In
Table 2 and
Figure 2F, the observed nitrite concentrations ranged from 0.0065 mg/L to 1.55 mg/L. WHO and GSA both set a guideline limit of 3.0 mg/L for nitrite in drinking water. The nitrite contents were within the acceptable standards for the Wells except for Well B which had the highest of 1.55 mg/L. Nitrite is more toxic than nitrate and poses immediate health risks because it directly oxidizes hemoglobin to methemoglobin, impairing oxygen transport in the blood
| [34] | Fewtrell, L. (2004) Drinking-water nitrate, methemoglobinemia, and global burden of disease: A discussion. Environmental Health Perspectives, 112(14). 1371–1374.
https://doi.org/10.1289/ehp.7216 |
[34]
. The exceedances observed in Wells B suggest possible microbial contamination, as nitrite is typically an intermediate product of nitrification and denitrification processes in groundwater
| [35] | Granger, J., Wankel, S. D. (2016) Isotopic overprinting of nitrification on denitrification as a ubiquitous and unifying feature of environmental nitrogen cycling. Proceedings of the National Academy of Sciences of the United States of America, 113(42). E6391–E6400.
https://doi.org/10.1073/pnas.1601383113 |
[35]
. Its presence above the permissible limit is particularly concerning, since nitrite is unstable and usually indicates active pollution, often from faecal matter or organic waste.
Overall, the results highlight the importance of continuously monitoring both nitrate and nitrite levels in drinking water sources. While most wells are within acceptable standards, the exceedances in certain wells reflect localized contamination risks. These findings also highlight the need for enhanced groundwater protection strategies, including the regulation of agricultural inputs, improvements in sanitation, and community water safety planning in the Sagnarigu Municipality.
3.8. Ammonium Content in Water Samples
From
Table 2 and
Figure 2G, the ammonium concentrations ranged from 0.001 to 1.6 mg/L, with Wells C, D, E, and G exceeding both WHO and GSA standards of 0.2 mg/L and 0.5 mg/L respectively. The ammonium content in Wells A and B were below both the WHO and GSA standards. Well F had its ammonium content exceeding the WHO limit but equaled the GSA limit. In Well H, the ammonium content exceeded the WHO limit but was below the GSA limit. Ammonium can occur naturally in water supplies. Sewage contains large amount of ammonia formed by bacterial decay of nitrogenous organic wastes. It is an indicator of possible bacterial, sewage and animal waste pollution
| [27] | Aryal J., Gautam B., Sapkota N. (2012) Drinking water quality assessment. J Nepal Health Res Counc. 10(3). 192-6. |
[27]
. Ammonium itself is not generally a direct toxicological concern at the concentrations encountered in drinking water; instead, it is valued as a diagnostic indicator of recent pollution (e.g., sewage intrusion, manure, or fertilizer inputs) and of potential chloramine formation issues during disinfection
| [20] | World Health Organization. (2022). Guidelines for drinking-water quality: Fourth edition incorporating the first and second addenda. Geneva: World Health Organization. Licence: CC BY-NC-SA 3.0 IGO. |
| [29] | World Health Organization. (2003). Total dissolved solids in drinking-water: Background document for development of WHO guidelines for drinking-water quality (WHO/SDE/WSH/03.04/16). Geneva: World Health Organization. |
[20, 29]
.
3.9. Heavy Metal Contents in Water Samples
Heavy metals are metallic elements with a specific weight greater than 5 g/cm
3 and are toxic at lower concentrations. Heavy metals comprised of the essential metals (Cu, Zn, Co, Cr, Mn, and Fe), non-essential metals (Ba, Al, Li, and Zr), less toxic metals (Sn and As), and highly toxic metals (Hg, Cd, and Pb). The presence of these toxic metals suggests either geogenic leaching from underlying rock formations or anthropogenic contamination, potentially from industrial effluents, improper waste disposal, or corroded pipelines
| [36] | Collin, S., Baskar, A., Geevarghese, D. M., et al. (2022) Bioaccumulation of Lead (Pb) and Its Effects in Plants: A Review. Journal of Hazardous Materials Letters, 3. Article 100064.
https://doi.org/10.1016/j.hazl.2022.100064 |
[36]
. Assessment of the adequacy of the heavy metals content in drinking-water relies on comparison of the results of water quality analysis with guideline values
| [20] | World Health Organization. (2022). Guidelines for drinking-water quality: Fourth edition incorporating the first and second addenda. Geneva: World Health Organization. Licence: CC BY-NC-SA 3.0 IGO. |
[20]
.
3.10. Lead Content in Water Samples
As can be seen in
Table 2 and
Figure 2H, lead (Pb) was detected in all the wells with its concentration within the 0.01 mg/L permissible limits for drinking water quality except Well F whose Pb concentration of 0.012 mg/L slightly exceeded both WHO and GSA standards. WHO emphasizes there is no known safe threshold of Pb for key neurodevelopmental effects, particularly in infants and young children, and retains 0.01 mg/L as a provisional target because achieving lower levels can be challenging with centralized conditioning alone. The exceedance observed in Well F is minor, but it still warrants attention, with priority given to source tracing and exposure control. Prolonged exposure to lead through drinking water is associated with cognitive impairment in children and kidney dysfunction in adults. Corrosion control (managing pH/alkalinity), replacing lead-bearing components and, as an interim measure, certified point of use filters for lead can reduce exposure
| [20] | World Health Organization. (2022). Guidelines for drinking-water quality: Fourth edition incorporating the first and second addenda. Geneva: World Health Organization. Licence: CC BY-NC-SA 3.0 IGO. |
[20]
.
3.11. Zinc Content in Water Samples
Zinc concentrations across the wells ranged between 0.005–0.025 mg/L and were all orders of magnitude below the WHO and GSA limit of 3.0 mg/L where aesthetic concerns typically arise. Toxicologically, WHO does not set a health-based guideline for zinc in drinking water quality because zinc intake primarily comes from the diet, and its concentrations in water that could cause health effects are much higher than those found in well-managed supplies
| [20] | World Health Organization. (2022). Guidelines for drinking-water quality: Fourth edition incorporating the first and second addenda. Geneva: World Health Organization. Licence: CC BY-NC-SA 3.0 IGO. |
[20]
. The results as presented in
Table 2 and
Figure 2I, therefore, suggest that Zn presents no health risk or palatability issue.
3.12. Mercury Content in Water Samples
All the wells recorded mercury levels of <0.001 mg/L, which fall below both the stringent WHO guideline but within the GSA threshold as presented in
Table 2 and
Figure 2J. From a health perspective, mercury in drinking water is mainly a concern in areas affected by mining activities or industrial discharges, since WHO technical documents emphasize its neurotoxicity and link it to global public health priorities such as those outlined in the Minamata Convention. In this case, the non-detections indicate that mercury does not pose an immediate public health concern in the study area. However, it would still be prudent to maintain periodic monitoring, especially if there are artisanal mining activities nearby or if the hydrogeology suggests the potential for long-range transport from upstream sources
| [20] | World Health Organization. (2022). Guidelines for drinking-water quality: Fourth edition incorporating the first and second addenda. Geneva: World Health Organization. Licence: CC BY-NC-SA 3.0 IGO. |
[20]
.
3.13. Cadmium Content in Water Samples
As presented in
Table 2 and
Figure 2K, all the measured Cd values were ≤ 0.002 mg/L and fell below the 0.003 mg/L permissible limit. WHO guidance retains 0.003 mg/L based on kidney toxicity, with
β2-microglobulin identified as the critical effect biomarker, and the long biological half-life emphasizes the importance of cumulative exposure control. The pattern of low but detectable results in several wells does not indicate current health concern but does warrant routine monitoring, as cadmium inputs may originate from phosphate fertilizers, waste disposal, or specific industrial sources
| [20] | World Health Organization. (2022). Guidelines for drinking-water quality: Fourth edition incorporating the first and second addenda. Geneva: World Health Organization. Licence: CC BY-NC-SA 3.0 IGO. |
| [37] | World Health Organization. (2003) Ammonia in drinking-water: background document for development of WHO guidelines for drinking-water quality. Geneva: World Health Organization. |
[20, 37]
.
3.14. Arsenic Content in Water Samples
As can be seen in
Table 2 and
Figure 2L, all the wells had arsenic content below 0.01 mg/L, the widely used risk-based goal that WHO designates as provisional given treatment and quantification constraints in many small systems. Arsenic is a potent chronic carcinogen with skin, vascular, and internal cancer endpoints; hence, even low but near threshold concentrations are taken seriously worldwide. The uniformly low values are reassuring and, in a Ghanaian context, suggest either favorable local geology or effective source protection because certain gold bearing formations can yield elevated geogenic arsenic. Continued periodic monitoring remains important due to spatial heterogeneity and seasonal shifts
| [20] | World Health Organization. (2022). Guidelines for drinking-water quality: Fourth edition incorporating the first and second addenda. Geneva: World Health Organization. Licence: CC BY-NC-SA 3.0 IGO. |
| [37] | World Health Organization. (2003) Ammonia in drinking-water: background document for development of WHO guidelines for drinking-water quality. Geneva: World Health Organization. |
[20, 37]
.
Table 2. Physicochemical water quality parameters of open wells.
Parameter | Unit | WHO Limit | GSA Limit | Well A | Well B | Well C | Well D | Well E | Well F | Well G | Well H |
Conductivity | µS/cm | 1500 | 1500 | 985 | 885 | 762.5 | 622.5 | 740 | 1020 | 695 | 835 |
Turbidity | NTU | 5.0 | 5.0 | 5.25 | 5.20 | 5.45 | 5.65 | 4.8 | 6.5 | 5.1 | 5.0 |
pH | units | 6.5–8.5 | 6.5–8.5 | 7.15 | 7.145 | 7.06 | 6.95 | 7.30 | 6.60 | 6.75 | 7.25 |
TDS | mg/L | 1000 | 500 | 507.5 | 607.5 | 499.5 | 521 | 612 | 700 | 485 | 530 |
Nitrate | mg/L | 50.0 | 50.0 | 2.35 | 3.55 | 11.25 | 2.85 | 6.75 | 9.25 | 10.8 | 3.3 |
Nitrite | mg/L | 3.0 | 3.0 | 0.0065 | 1.55 | 0.0095 | 1.25 | 0.8 | 0.5 | 1.1 | 0.3 |
Ammonium | mg/L | 0.2 | 0.5 | <0.001 | <0.089 | 1.255 | 0.955 | 0.75 | 0.5 | 1.6 | 0.45 |
Lead | mg/L | 0.01 | 0.01 | <0.005 | <0.005 | 0.0085 | <0.001 | 0.007 | 0.012 | 0.003 | 0.006 |
Zinc | mg/L | 3.00 | 3.00 | 0.006 | 0.0085 | 0.015 | 0.007 | 0.010 | 0.025 | 0.018 | 0.005 |
Mercury | mg/L | 0.006 | 0.001 | <0.001 | <0.001 | <0.001 | <0.001 | <0.001 | <0.001 | <0.001 | <0.001 |
Cadmium | mg/L | 0.003 | 0.003 | 0.0015 | 0.001 | <0.002 | <0.002 | 0.002 | 0.0015 | <0.002 | 0.001 |
Arsenic | mg/L | 0.01 | 0.01 | 0.001 | 0.001 | <0.001 | <0.001 | 0.002 | 0.0015 | <0.001 | 0.001 |
Figure 2. Physicochemical water quality parameters of open wells.
Table 3. Summary of Descriptive Statistics of Physicochemical Parameters in Wells A–H.
Parameter | Min | Max | Mean | SD | WHO/GSA Limit |
Conductivity (µS/cm) | 622.5 | 1020 | 818.75 | ±121.2 | 1500 |
Turbidity (NTU) | 4.8 | 6.5 | 5.37 | ±0.49 | 5.0 |
pH | 6.60 | 7.30 | 7.04 | ±0.23 | 6.5–8.5 |
TDS (mg/L) | 485 | 700 | 570.56 | ±73.7 | 1000/500 |
Nitrate (mg/L) | 2.35 | 11.25 | 6.65 | ±3.10 | 50.0 |
Nitrite (mg/L) | 0.0065 | 1.55 | 0.777 | ±0.61 | 3.0 |
Ammonium (mg/L) | 0.001 | 1.6 | 0.626 | ±0.52 | 0.2/0.5 |
Lead (mg/L) | 0.001 | 0.012 | 0.0059 | ±0.0043 | 0.01 |
Zinc (mg/L) | 0.005 | 0.025 | 0.011 | ±0.0067 | 3.00 |
Mercury (mg/L) | 0.001 | 0.001 | 0.001 | 0 | 0.006/0.001 |
Cadmium (mg/L) | 0.002 | 0.002 | 0.0012 | ±0.00058 | 0.003 |
Arsenic (mg/L) | 0.001 | 0.002 | 0.0010 | ±0.00063 | 0.01 |